Recently, FENG Haicheng and LI Shasha from the Yunnan Observatories, Chinese Academy of Sciences, along with their collaborators, published a study in The Astrophysical Journal exploring the distinct characteristics of the inner and outer broad-line regions (BLRs) in active galactic nuclei (AGNs).
The BLR is a key component of AGNs, where gas clouds move at high velocities under the gravitational influence of the central supermassive black hole (SMBH), producing broad emission lines via Doppler broadening. Investigating the geometry and kinematics of the BLR is crucial for understanding the black hole environment and accurately measuring black hole masses. The BLR is generally believed to have an extended geometric structure and diverse dynamical properties. According to the "local optimally emitting cloud" model, the BLR exhibits radial ionization stratification, with different emission lines originating at varying distances from the SMBH. This prediction has been confirmed by reverberation mapping (RM) observations. However, most current studies rely on RM measurements using a single emission line, which limits the understanding of BLR gas distribution and kinematics.
To address this, the researchers proposed a method for RM observations using multiple emission lines to provide a more comprehensive view of BLR geometry and kinematics. They applied this approach to two highly variable AGNs, KUG 1141+371 and UGC 3374. The results revealed significant radial ionization stratification, consistent with photoionization models, and substantial differences in the geometry and kinematics of the inner and outer BLR. Assuming that velocity-resolved time delays reflect BLR dynamics, their findings include the following: In KUG 1141+371, the inner BLR exhibits outflowing motion, while the outer BLR is dominated by virialized motion. Conversely, in UGC 3374, the outer BLR shows inflowing motion, while the inner BLR remains virialized.
The researchers also discovered a transition from "breathing" to "anti-breathing" behavior between the inner and outer BLR, highlighting distinct physical properties. To interpret these findings, they explored various possible scenarios for BLR formation, including the roles of radiation pressure, magnetically driven winds, and the tidal disruption of dusty gas clouds. The observed geometric and kinematic stratification naturally explains the rapid changes in velocity-resolved RM signals reported in recent studies and sheds light on the scatter in black hole mass estimates derived from different emission lines or luminosities.
This study emphasizes the importance of long-term, multiline RM observations for unraveling the complex geometry and evolution of the BLR in AGNs. The team plans to combine this approach with multi-wavelength spectroscopic monitoring to disentangle the effects of BLR geometry and kinematics, thereby improving black hole mass measurement accuracy. As the RM sample size grows, the connection between the BLR, accretion disk, and dusty torus will become clearer, advancing the understanding of gas dynamics near SMBHs.
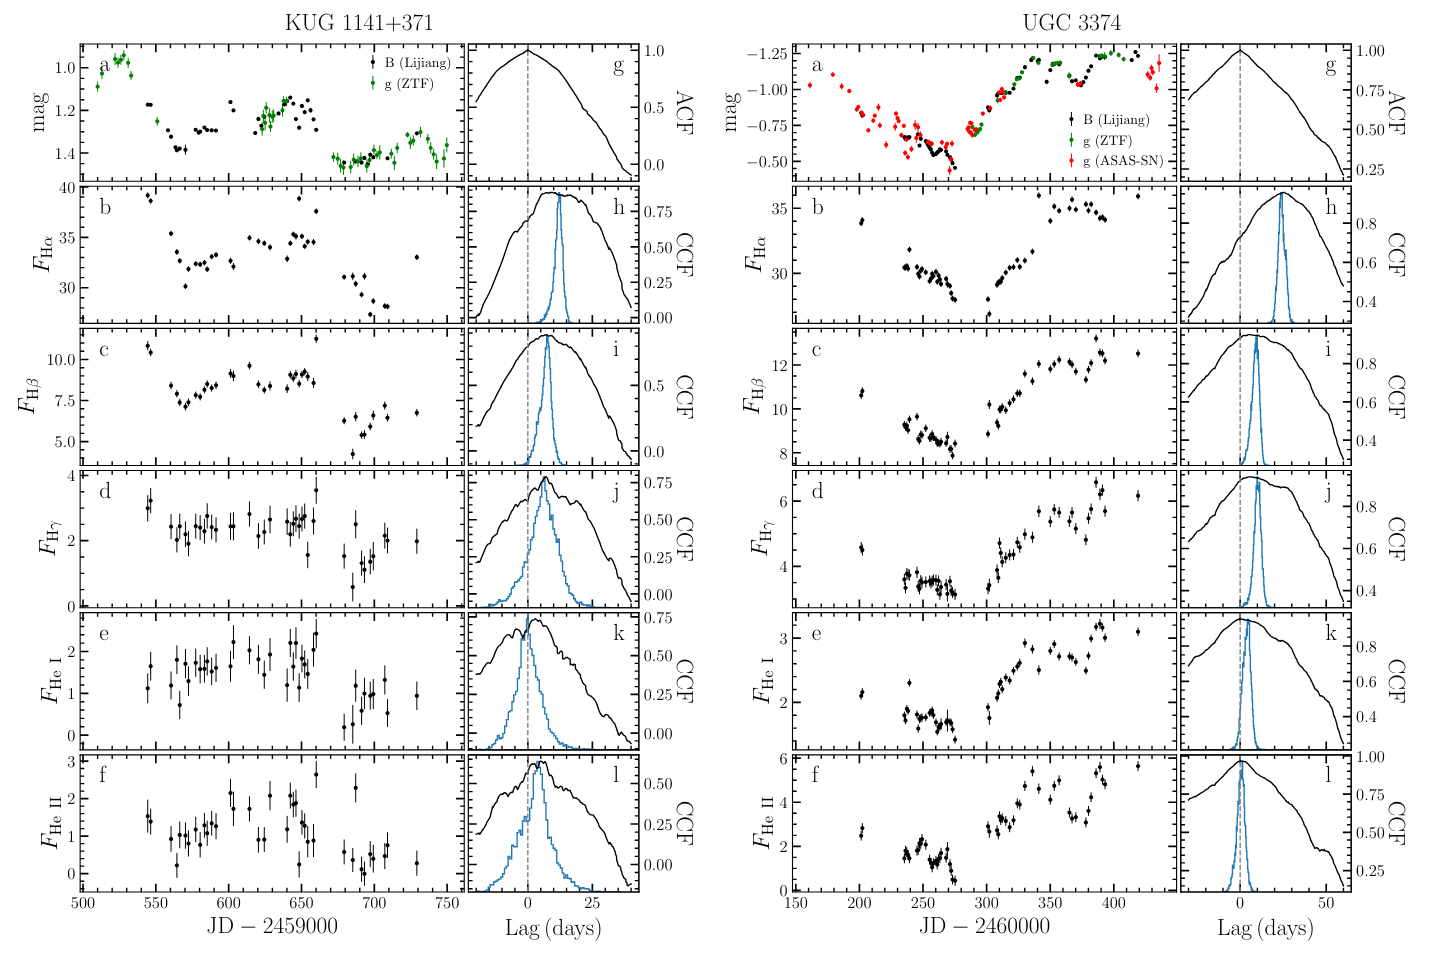
Figure 1: Light curves and CCF results for KUG 1141+371 (left) and UGC 3374 (right). Subplots (a)-(f) show the light curves for photometry, Hα, Hβ, Hγ, He I, and He II emission lines. Subplot (g) presents the ACF results of the photometric light curve. Panels (h)-(l) display the CCF results (black line) and the CCCD (blue line) between the emission lines and photometric light curve. Image by FENG.

Figure 2: Velocity-resolved time delays for KUG 1141+371 (left) and UGC 3374 (right). Each subplot presents the results for the Hα, Hβ, Hγ, He I, and He II emission lines, divided into two panels. The upper panels show the time delay for each velocity bin, with the horizontal dashed lines indicating the mean delay for each emission line and the gray shaded regions representing the corresponding uncertainties. The vertical gray dashed lines mark the boundaries of each velocity bin. In the lower panels, the black stepped lines depict the RMS spectra generated from the broad emission line profiles, with the vertical gray dashed lines again marking the boundaries of each velocity bin. Image by FENG.
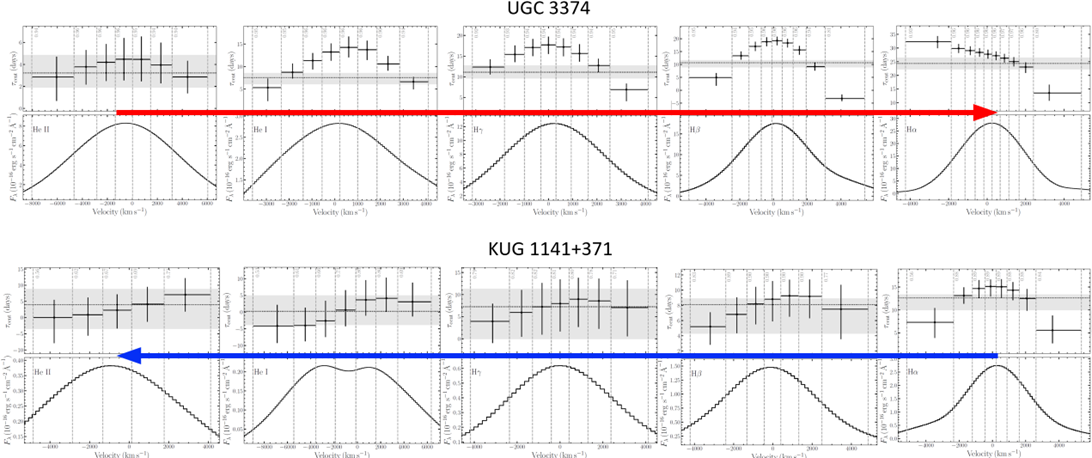
Figure 3: Velocity-resolved time delays for UGC 3374 (top) and KUG 1141+371 (bottom). Each subplot presents the results for the Hα, Hβ, Hγ, He I, and He II emission lines, divided into two panels. The upper panels show the time delay for each velocity bin, with the horizontal dashed lines indicating the mean delay for each emission line and the gray shaded regions representing the corresponding uncertainties. The vertical gray dashed lines mark the boundaries of each velocity bin. In the lower panels, the black stepped lines depict the RMS spectra generated from the broad emission line profiles, with the vertical gray dashed lines again marking the boundaries of each velocity bin. Image by FENG.
Contact:
FENG Haicheng
Yunnan Observatories , CAS
Email: hcfeng@ynao.ac.cn