Recently, researchers from Yunnan Observatories of the Chinese Academy of Sciences, including WANG Jinliang, DING Xu (the corresponding author), and JI Kaifan have developed a method that combines machine learning with Bayesian inference to rapidly solve the light curve parameters of contact binary systems from the Catalina Sky Survey. This research has been published online in the Astrophysical Journal Supplement Series.
Contact binaries are a class of strong interaction systems, where both component stars fill their respective Roche lobes and share a common envelope. Their light variations primarily arise from mutual eclipses of the two stars, and through complex interactions within the common envelope, they serve as natural laboratories for studying various special physical processes. The advent of large-scale photometric surveys, such as TESS, ZTF, CSS, has resulted in the acquisition of tens of thousands of light curves, providing excellent opportunities to study contact binary systems. However, there is a pressing need for new methods to rapidly solve the parameters of these systems given the vast amount of data.
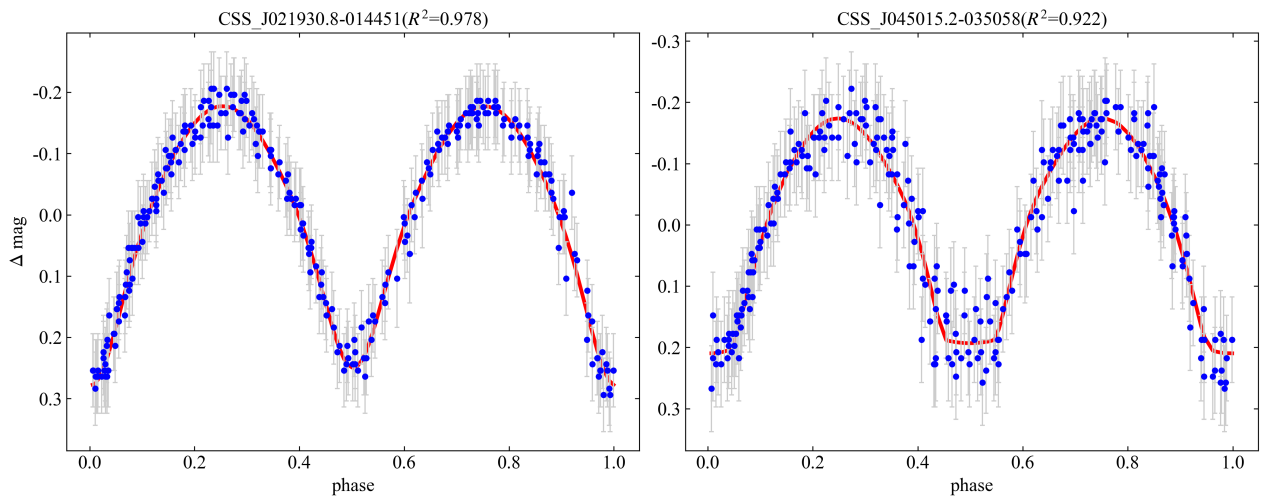
The researchers initially established a neural network model to map parameters to light curves, enabling the efficient generation of synthetic light curves. Subsequently, they employed the Hamiltonian Monte Carlo algorithm to rapidly solve the observed light curves. Ultimately, they obtained the posterior distribution of the parameters and computed the median and uncertainties.
Using this method, the researchers solved the light curve parameters for a total of 5172 late-type contact binary systems from the Catalina Sky Survey, including temperature ratio, mass ratio, orbital inclination, and fill-out factor. This approach has the capability to simultaneously solve the parameters of a large number of targets, making it an efficient tool for analyzing large samples of contact binary systems. Especially in upcoming large-scale sky surveys, this method will play a significant role in rapidly and accurately determining system parameters.
This research was supported by the National Natural Science Foundation of China.

Figure 1, the blue dots and gray lines represent the observed light curves with photometric errors, while the red line represents the synthetic light curve generated by inputting the parameters derived from the new method into the PHOEBE program. Image by WANG.
Contact:
WANG Jinliang
Yunnan Observatories, CAS
E-mail: wangjinliang@ynao.ac.cn